At a glance
Customer-facing integration observability starts at the customer level because a healthy service can still hide a stale or failed sync for one account. Each customer needs a traceable sync history with provider errors that identify the failing field, supported by tenant-level metrics and alerts that surface the affected account before a support ticket arrives.
This guide compares per-customer logging and alerting across deep integration platforms, unified APIs, embedded iPaaS tools, and DIY connectors. Ampersand records every operation against a customer installation and carries the customer identifier into logs and notifications, so teams can associate a failed operation with the affected account.
Silent Sync Failures Reach Your Customer Before They Reach You
Imagine this scenario: on Friday morning, the APM dashboard is green. Request latency sits in its normal band, the aggregate error rate stays under threshold, and every service reports healthy. Customer X’s Salesforce sync has not completed since Tuesday afternoon, and the product still shows a connected badge. The customer’s RevOps lead is building a board deck from a pipeline view that ends three days early, and nobody on the product team knows the data is stale.
Because the customer is the first person to notice, the issue follows a predictable escalation path:
- Customer discovery: The RevOps lead notices the stale pipeline data and files a support ticket.
- Support escalation: Support cannot determine whether the failure comes from the product or the customer’s Salesforce configuration, so the ticket moves to engineering.
- Engineering diagnosis: An engineer filters the logs by customer and timestamp, then finds a failed OAuth token refresh on Tuesday.
A customer-level alert could surface the failed token refresh while fleet-wide monitoring misses it. If 400 tenants produce equal request volume, one tenant accounts for 0.25% of requests. Even if every sync for that tenant fails, the aggregate error rate may stay below the configured threshold. The dashboard reports fleet health accurately and says nothing about one customer’s experience.
Stale data can avoid error counts entirely when a high-volume Salesforce tenant occupies shared workers and delays jobs for quieter tenants in a shared polling queue. Because delayed jobs run late without failing, they can still report success and leave no exception to trace, which is one reason polling isn’t good enough for integrations customers depend on.
For embedded integrations, sync health is part of product reliability. When customers discover stale data before the vendor, the incident can erode confidence in the product and surface in the next renewal discussion.
What Integration Observability Means for Customer-Facing Integrations
Integration observability is the ability to diagnose one customer’s connection from telemetry the platform already produces, without writing an ad hoc query or adding instrumentation mid-incident. Four capabilities decide whether support can reach the cause or has to escalate.
Per-customer sync logs: Group every read, write, or subscription attempt under the customer identifier, with its timestamp, outcome, and provider response. A support engineer should be able to retrieve the complete sync history in under a minute using a customer name or account reference already available to them.
Field-level error attribution: An error should identify the affected customer and object before pointing to the record and field that failed. A message stating that a Salesforce write failed creates an investigation, but one naming the rejected field and provider response directs the team toward the cause.
Per-tenant metrics: Measure throughput, retry counts, latency, and the last successful sync for each tenant. Fleet-wide averages remain useful for capacity planning but cannot show whether one customer’s integration is healthy.
Proactive alerts: Alerts should fire for the specific failure class and carry the customer identity in the payload. If the receiving team must correlate an internal ID with a separate customer table, the alert has already delayed the response it was meant to accelerate.
Infrastructure observability asks whether the services you operate are healthy. Integration observability asks whether one customer’s data is moving correctly, which requires customer-scoped logs and alerts that fleet-level APM metrics do not provide.
Monitoring webhook destinations is also part of integration observability because data delivery fails when the receiving endpoint rejects payloads. Ampersand emits a destination.webhook.disabled event when a destination is disabled, which can happen after repeated failed delivery attempts. This event identifies the destination; map it to the installations using that destination to determine customer impact.
Integration Failures Are Tenant-Scoped, and Aggregate Metrics Hide Them
Customer-facing integration failures usually remain inside one tenant because each customer controls separate credentials, permissions, quotas, and schema. Four common patterns can cause support tickets without changing a fleet-wide metric enough to trigger an alert:
Token expiry and revocation: If one customer’s refresh token becomes invalid or an administrator revokes the connected app during a security review, every operation for that tenant can stop even though the remaining customer connections stay healthy. The provider-wide error rate may barely change because the failure volume belongs to a single account.
Permission changes: A customer administrator can remove access to an object or field that the integration still requests. In Salesforce, even a System Administrator profile may lack visibility into a required field, which explains how identical reads can succeed for every other customer and fail for one org.
Quota and rate limits: Salesforce change-event allocation is shared across the integrations connected to one customer’s org. If another vendor consumes the available allocation, data delivery can stop for your integration even though your services and every other customer connection remain healthy.
Schema drift: Customer-specific schemas evolve independently, so a renamed or deleted custom field may break the mapping for one org without affecting any other customer. The wider integration fleet continues syncing and keeps aggregate health metrics within their expected range.
These failures can affect a single customer, so metrics averaged across customers may dilute the signal. Permission and schema issues may not generate enough error volume to cross a fleet-level threshold, and delayed delivery can stop data movement without producing an exception. Customer-scoped logs, metrics, and alerts make those failures easier to detect.
How Each Platform Class Handles Per-Customer Integration Monitoring
Across the best SaaS integration platforms, what separates the observability models is the unit each product records. Workflow platforms may group execution records by customer, while installation-based platforms group operations by installation. Evaluate the actual customer view and diagnostic detail rather than assuming the category determines the experience.
DIY and Open-Source Connectors: Full Control, Self-Built Integration Logs
Building directly against provider APIs preserves the original error response because no platform normalizes the message before it reaches your application. Direct API access gives engineering teams complete control over storage and analysis, though per-customer dashboards still require deliberate instrumentation.
Tenant indexing, retry histories, last-success timestamps, alert thresholds, and routing rules all become part of the internal roadmap. If this work is postponed, the observability layer often takes shape only after support escalations reveal missing diagnostic context.
Unified APIs: Aggregate Issue Detection Above a Common Schema
Unified APIs generally organize observability around the linked account. Merge exposes account status and issue records that help teams identify connections that need attention, and webhooks can send account events into internal systems.
Normalization makes credential and permission failures easier to classify consistently across providers. Provider-specific field behavior can lose detail when the error passes through a common schema, so field-level diagnosis may require deeper provider logs. Ask each unified API vendor to show its raw provider logs and error detail; normalization does not necessarily remove access to the original response.
Embedded iPaaS: Execution-Level Logs and Step-Level Error Attribution
Observability in embedded iPaaS providers begins with the workflow execution. Prismatic records execution timing, step status, and error details, with customer-specific log views and external log streaming. Paragon combines workflow history with a Connected Users dashboard for reviewing integration health by customer, and Workato provides usage and operational views across customer workspaces.
These platforms can expose the exact workflow step and payload associated with an error. Customer-level views can bring those executions together. Check whether they also expose data freshness and sync completeness, and how alert configuration is maintained across instances or flows as deployment volume grows.
Deep Integration Platforms: Per-Customer Sync Observability as a Primitive
Ampersand uses the customer installation as an operational boundary. Its Browse Operations view lets teams inspect reads, writes, subscriptions, and searches across installations, then open operation logs for diagnosis.
Notification payloads carry context appropriate to the event: connection events identify the connection and customer group, while installation events also identify the installation. Shared notification topics route selected events to configured destinations. Check which metrics and thresholds are built in and which your application must calculate.
| Platform class | Unit of observation | Customer sync history | Error detail | Per-customer metrics | Alerting model |
|---|---|---|---|---|---|
| DIY and open-source connectors | API request or event | Limited to internal instrumentation | Raw provider response | Built internally | Custom rules and routing |
| Unified APIs | Linked account or common-model sync | Account status, issues, and sync records | Normalized error with variable provider detail | Linked-account sync and issue status | Webhooks and account-status changes |
| Embedded iPaaS | Workflow execution or customer instance | Customer views of workflow runs and logs | Step inputs, outputs, and provider payloads | Execution counts, duration, and job status | Configured by instance or flow |
| Ampersand | Customer installation | Operation history grouped by installation | Operation logs with available provider error detail | Operation status and history by installation | Connection, installation, and destination events routed through topics |
The Integration Observability Buyer’s Checklist
Six questions reveal whether a platform provides customer-level observability or simply makes execution records searchable. Ask each vendor to demonstrate its answers using a named customer and a realistic integration failure.
1. Can I see one customer’s complete sync history in the error-tracking dashboard?
Ask the vendor to open a customer record and show every integration operation in chronological order, including its status and provider response. The customer should be searchable using a name or account reference already available to support. If support must translate identifiers or guess the relevant time range, include that work in the evaluation.
2. Can support answer whether customer X’s integration is healthy without an engineer?
Support should have a customer-level view that includes connection status, last successful sync, active failure, retry state, and the latest provider response. Test the workflow by giving a support representative a named account and asking them to identify the problem without querying a database or reading raw execution payloads. If engineering must correlate identifiers across systems, every integration incident increases the engineering support load.
3. Can I attribute an error to a specific record and field?
A useful error should connect the affected customer to the operation, object, record, and field that caused the failure. “The Account sync failed” only identifies where an investigation begins, whereas an error naming the inaccessible field and the provider response gives support a resolution it can send to the customer administrator.
4. What is the best way to monitor customer-specific connector latency?
Track execution duration alongside data age for each customer. Execution duration measures how long the connector ran, whereas data age measures the gap between a source-system change and its arrival in your product. Alerting on both values distinguishes a slow operation from a healthy-looking process that continues delivering stale data.
5. Can I set SLA alerts when embedded connectors start throttling due to rate limits, or when a token expires?
Evaluate token failures and rate-limit throttling as separate alerting requirements because platforms often handle them differently. Token errors commonly produce a connection event or account status change. Throttling often triggers retries or backoff quietly, with no dedicated alert to subscribe to. Salesforce deserves its own question here because change-event allocation is shared across every integration in the customer’s org, so a second vendor can consume it and stop your delivery while your own services stay healthy.
6. How long are integration logs retained, and can I stream them into the observability stack I already run?
The retention period should exceed the time customers have to report an issue and the period your team needs for incident review. Confirm whether logs can be exported or streamed into the existing observability stack without losing the customer identifier, provider response, or operation sequence. If replay is available, verify whether it reuses the original payload and how it prevents duplicate writes.
How Ampersand Approaches Per-Customer Integration Observability
Ampersand treats each installation as a distinct customer instance. Operations and configuration remain tied to that installation, while connection and destination events carry their own relevant identifiers, giving support and engineering teams the customer context they need throughout an incident. The Ampersand integrations catalog lists available provider coverage, making it easier to evaluate which customer-facing integrations can use the same operational model.
Operation-level history across customer installations
The Ampersand dashboard records read, write, subscribe, and search operations for each installation. Teams can filter operations by customer, status, action, or object before opening the associated logs for a detailed diagnosis. The same operation data is available through the API when teams need to incorporate integration health into internal support tools.
Configuration validation before the first scheduled sync
When a customer creates an installation, Ampersand runs a sample read for each enabled scheduled read object. Updates re-sample objects whose configuration could have changed. This check confirms that requested fields exist and that the connected user can access them. A configuration with an invalid field or a field-level permission issue returns the provider error during setup, giving the customer a chance to correct it before the integration begins syncing. Sampling is enabled by default and runs automatically in the InstallIntegration component for @amp-labs/react version 2.13.5 and later.
Notifications that retain customer identity
Ampersand emits typed events for connection problems, paused reads, failed subscriptions, installation changes, completed operations, and disabled webhook destinations. Teams can route selected events through topics to Slack, webhooks, Kinesis, or Amazon S3. The notification event types and routing options let you alert on failures across the integration catalog without configuring a separate monitor for every connector.
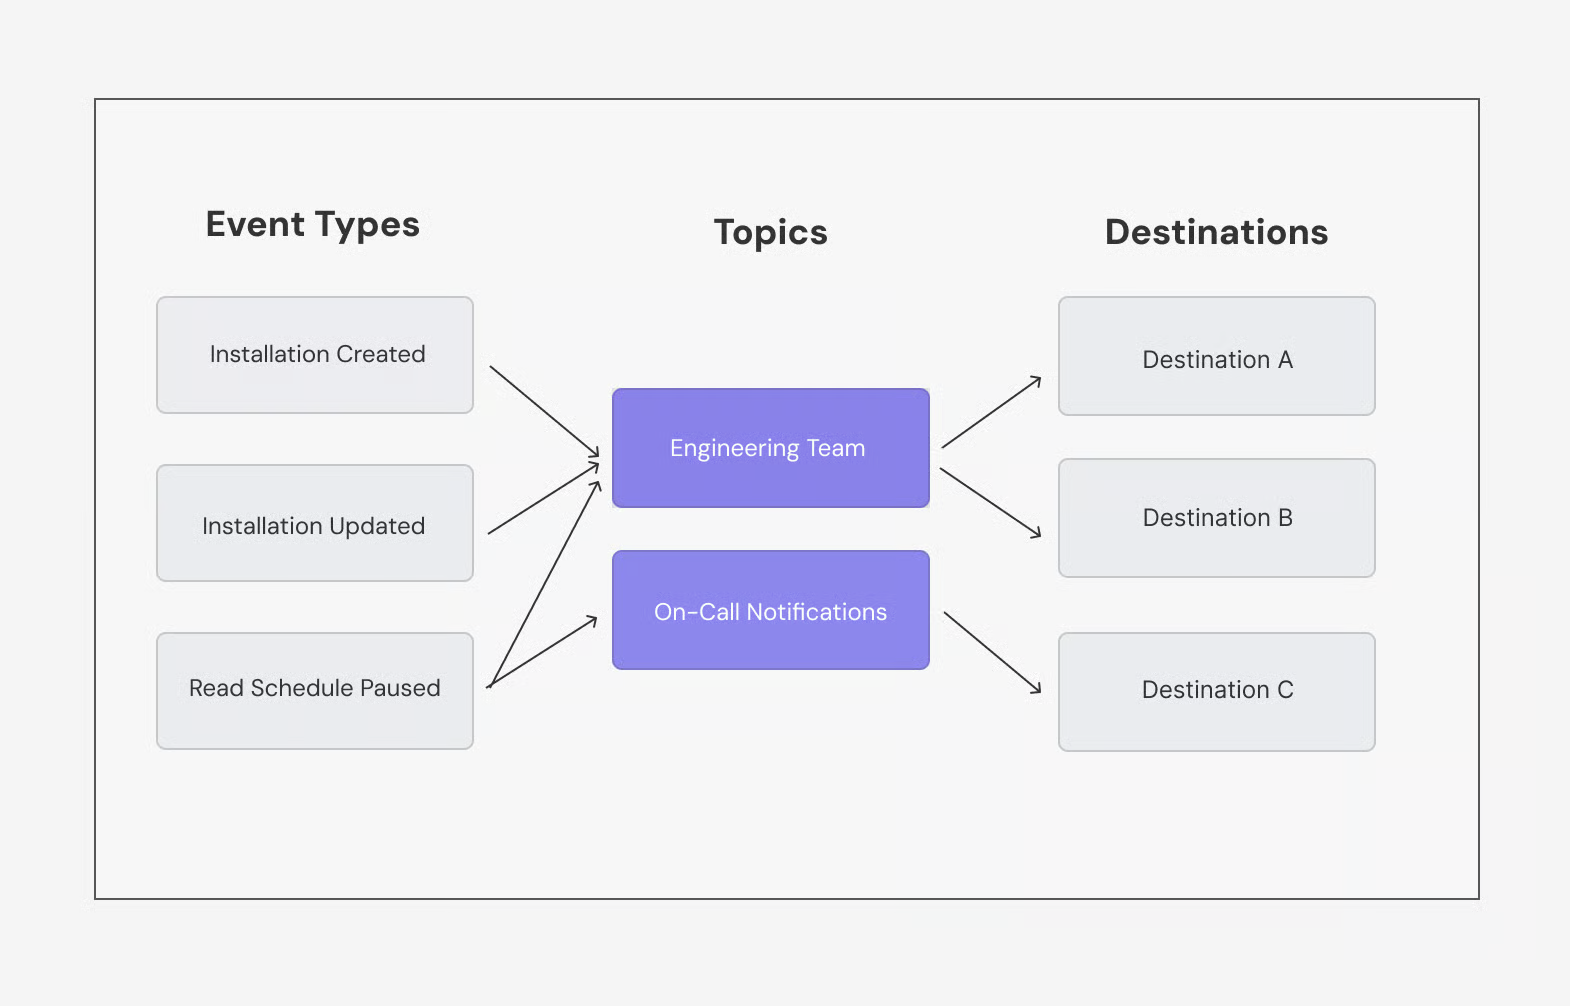
Ampersand routes selected integration events through notification topics to configured destinations.
A practical starting set includes connection.error, read.schedule.paused, and subscribe.create.error. Together, these events cover authentication failures, interrupted scheduled reads, and subscriptions that could not be created. The following illustrative webhook payload shows the customer and connection identifiers carried by a connection error:
{
  "notificationType": "connection.error",
  "data": {
    "projectId": "8f4a2b1c-3d5e-4f6a-9b0c-1d2e3f4a5b6c",
    "connectionId": "c4e7f2a1-8b3d-4f6e-9a2c-5d1e3f4b6a7c",
    "provider": "salesforce",
    "groupRef": "customer-group-ref",
    "consumerRef": "user-123",
    "consumerName": "John Doe",
    "errors": [
      "Authentication failed",
      "Token refresh error"
    ]
  }
}
groupRef is your customer reference, while consumerName names the connected user; it is not the customer account name. Your handler can use those identifiers to enrich and route the alert. An application can respond to connection.error by prompting reauthentication when appropriate. The notification documentation distinguishes connection.updated, which includes reauthentication and other connection updates, from connection.refreshed, which reports automatic OAuth token refresh. Confirm the connection is healthy before clearing an incident.
Provider errors preserved for record and field-level diagnosis
Operation logs and surfaced provider errors help diagnose failures. A Salesforce read can therefore identify the column that caused the request to fail, helping the team determine whether the field is absent from that customer’s org or hidden from the connected user. Once the underlying access issue is resolved, paused reads can resume for the affected installation without disrupting healthy customer syncs.
Real-time data delivery alongside failure alerts
Notifications report lifecycle changes and operational problems. Subscribe Actions deliver CRM events themselves as they occur. Removing the polling interval makes data freshness easier to evaluate because a delayed record on an event-driven connection points to a delivery or processing problem rather than the normal wait for the next scheduled read.
Versioned configuration for consistent operations
Schedules, objects, fields, and references to configured destinations are declared in amp.yaml, so the integration definition can pass through code review with the rest of the application. Teams can deploy the same configuration through the Ampersand CLI across development and production projects. Keep the manifest in version control so the team can compare configuration changes when investigating an incident. Notification topics and routes are configured separately in the dashboard or API.
Start with Ampersand to add per-customer observability to every integration →
Frequently asked questions
What is integration observability?
Integration observability is the ability to reconstruct what happened during a customer’s sync and identify the cause of an unexpected result. It connects each operation to the relevant customer, provider request, returned error, and resulting data so teams can investigate without reproducing the issue in a separate environment.
What is the difference between integration monitoring and integration observability?
Monitoring reports a known condition, such as a failed sync or an expired connection. Observability provides the context needed to explain that condition, including which customer was affected and where the operation failed. Monitoring can therefore trigger the investigation, but observability supplies the evidence required to resolve it.
What’s the simplest way to get real-time error monitoring across dozens of embedded CRM connectors?
Route connector failure events into one shared webhook or support channel, then use the customer identifiers in each payload to direct the alert to the correct account. Ampersand provides notification payloads for connection errors, paused reads, failed subscriptions, unsuccessful triggered reads, and disabled destinations. This gives teams one event structure across supported CRM connectors without requiring separate alert logic for every provider.
How do platforms surface per-tenant metrics like throughput, retries, and latency for integrated systems?
The available metrics usually reflect the platform’s execution model. Unified APIs report sync status and issue counts for each linked account, whereas embedded iPaaS products commonly measure workflow runs within a customer workspace. Installation-scoped operation records provide a basis for customer-level analysis. Ask which throughput, retry, latency, and freshness metrics are available directly, and which require calculation in your own monitoring stack.
How does integration observability relate to change alerts and rollback?
Integration observability identifies the affected customer and the failed operation. Change alerts reveal the configuration or provider change that preceded the failure. If a deployment caused the incident, safe rollback and migration paths help teams restore the last working version and recover the customer’s integration sooner.